
Download U-Pb Saturn – Instructions
INTRODUCING U-Pb SATURN
Saturn is a robust, non-commercial software tool tailored for geochronologists working with U-Pb data from various ICP-MS instruments, whether multi-collector or single-collector. Written in Python, it operates independently, eliminating the need for additional commercial software. The platform processes and interprets individual data files using an integrated system of interactive tables and graphical windows. These windows simultaneously display background-corrected, time-resolved signals and corresponding isotopic plots—such as Tera-Wasserburg, Wetherill concordia, and Isochron diagrams—allowing for real-time data analysis. This synchronous display of data enhances the reliability of processing, especially for complex or large datasets.
One of Saturn’s key strengths is its ability to work with large datasets, supporting up to 1000 analytes, making it an ideal tool for handling intricate samples. Additionally, its real-time processing capabilities allow users to monitor ongoing analyses during ICP-MS runs, making it particularly useful for quality control purposes during Laser Ablation (LA-ICP-MS) processes. Users can visualize parts or the entire dataset dynamically as new data is generated, improving efficiency and reducing the need for post-run data reviews.
The interconnected graphical windows offer a significant advantage as they allow users to simultaneously visualize time-resolved signal data alongside geochronology plots, enabling quicker insights and better decision-making. These capabilities are particularly beneficial when handling complex samples, ensuring that critical details are not missed during analysis. The software also allows users to manually adjust and optimize background regions in real-time for more accurate signal interpretation.
Saturn is available as a free download, and users are encouraged to explore the accompanying instructional videos, which provide guidance on setting up and optimizing the software for data reduction, further enhancing its accessibility and user-friendliness.
Downloading and Installing
Saturn is designed for simplicity and portability, eliminating the need for installation. It runs directly from its folder and can easily be transferred between Windows computers without requiring activation keys or installation procedures. This makes it highly convenient for users who need flexibility in their workflow. A version for Mac is under development, expanding accessibility. To start using Saturn, simply download the software, place it in the desired directory, and follow the step-by-step instructions provided in the accompanying video tutorials for seamless operation.
Download Saturn using the link below.
_______________________________________________________________________________________________________________
DOWNLOAD SATURN 2.03 – WINDOWS 10 AND 11
__________________________________________________________________________
Saturn 2.0 Test Drive Files – AGILENT 8800 U-Pb Geochron
Saturn 2.0 Test Drive Files – ELEMENT 2 U-Pb Geochron
Saturn 2.0 – Detrital Zircons- Data Reduction
Auto-Selection Feature in Saturn 2.03
The Auto-Selection feature in Saturn 2.0 streamlines the process of selecting Reference Materials (RMs) and Samples, ensuring a more efficient workflow in U-Pb data processing. Instead of manually searching through long lists, this feature allows users to quickly locate and highlight the desired items based on a simple text input.
How It Works
- User Input
- The user enters a partial or full name of the reference material (e.g.,
"GJ1") or sample (e.g.,"SAMP_5") into the search field.
- The user enters a partial or full name of the reference material (e.g.,
- As soon as the user presses the Auto Select RM Button AGAIN, the system scans the Standard List (for RMs) or Sample List for matching entries.
- If a match is found, the corresponding item is automatically highlighted and selected.
- Immediate UI Feedback
- The selected item is visually marked in the list, making it clear that it has been chosen.
- If no match is found, an informative message is displayed, guiding the user to re-enter the correct name.
- Auto-Close Behavior
- Once a selection is made, the search field automatically disappears, keeping the interface clean and preventing unnecessary clutter.
Drift Correction in Saturn 2.0
Drift corrections compensate for long-term signal changes due to laser fluctuations, instrumental drift, or changing ablation conditions. Saturn 2.0 allows users to apply polynomial drift correction to correct these systematic changes over longer timescales.
🔹 Polynomial Drift Correction
- This method adjusts for drift by fitting a polynomial to long-term trends in the data.
- Useful when the signal slowly shifts over multiple analyses due to instrument instability or changes in laser performance.
🔹 When to Apply Drift Correction
- When data shows a progressive shift in isotope ratios over time.
- If reference materials indicate a systematic bias in multiple analyses.
Saturn 2.0 – Fractionation Corrections
In Laser Ablation, fractionation correction is essential for accurate isotopic analysis, as it helps address laser-induced variations that occur during ablation. The three types of fractionation corrections implemented here—Linear, Exponential, and Polynomial—apply different mathematical approaches to refine the Pb/U ratio measurement. Here’s a breakdown in plain language:
1. Linear Fractionation Correction
- Goal: This approach fits a straight line to the Pb/U signal data, assuming that fractionation occurs linearly over time.
- How It Works: It performs a simple linear regression on the signal data points (values above a certain threshold), creating a correction by adding or subtracting from each data point based on the trend. The corrected values help smooth out any deviations that might have occurred during analysis.
- When to Use: Linear correction is best when fractionation appears stable and increases or decreases consistently, without rapid fluctuations.
2. Exponential Fractionation Correction
- Goal: This approach models fractionation as an exponential function, which is useful when the rate of fractionation isn’t constant but follows an accelerating or decelerating trend.
- How It Works: It calculates a corrected Pb/U ratio by fitting an exponential curve to the signal data, assuming fractionation behaves in a way that intensifies over time. This method is more flexible for samples where the fractionation rate changes gradually.
- When to Use: Exponential correction is ideal when fractionation builds up over time, such as when heat or other conditions cause accelerating effects on isotopic ratios.
3. Polynomial Fractionation Correction
- Goal: This correction method uses a higher-degree polynomial to capture more complex fractionation patterns, accommodating non-linear changes with more precision.
- How It Works: A polynomial curve, often quadratic or cubic, is fitted to the data to represent fractionation patterns that might oscillate or show irregular changes. This flexibility allows correction in datasets where the fractionation rate varies in complex ways.
- When to Use: Polynomial correction is suitable for datasets with unpredictable or fluctuating fractionation, especially when other models don’t fit well.
Saturn 2.0 – Example of Fractionation and Drift Correction for Long Dataset
Watch the video first and learn the application of Fractionation and Drift correction using Saturn 2.0. Below is a clear explanation of what is important about fractionation correction and drift correction in LA ICP MS.
The Fractionation Correction options in Saturn can be accessed directly from the main window, as seen in the bottom-right section of the left panel under “Fractionation Correction.”

Each correction method has a unique advantage depending on the fractionation pattern in the sample, allowing Saturn to apply the most accurate correction for robust isotopic analysis.
- No Correction: This option leaves the data uncorrected, which might be suitable if fractionation is negligible or has already been accounted for elsewhere.
- Linear Correction: This applies a straightforward, linear correction, assuming that fractionation changes consistently over time. It’s useful when fractionation appears stable and does not fluctuate significantly.
- Exponential Correction: This option models fractionation as an exponential process, accounting for cases where fractionation accelerates or decelerates over time.
- Poly Correction: This uses a polynomial function to correct fractionation, ideal for complex fractionation patterns that are non-linear and may vary in unpredictable ways.
These options allow users to select the most appropriate correction based on the behaviour of fractionation in their dataset, ensuring accurate isotopic measurements in their analysis.
In Saturn, the fractionation behaviour can be visualized and checked using the Fractionation window. This window provides a graphical representation of the isotopic ratios over time, helping users assess the consistency and trends in fractionation for each analysis.
2. Exponential Fractionation Correction
🔹 Goal: This method assumes that fractionation follows an exponential trend over time, where the rate of change decreases progressively.
🔹 How It Works:
- The Pb/U ratio is modelled using an exponential function, meaning the correction factor is determined based on a decaying or accelerating fractionation rate.
- It fits the data to an exponential curve, adjusting each data point accordingly.
- The correction factor is applied such that it accounts for strong initial fractionation that stabilizes over time, a behaviour commonly observed in laser ablation.
🔹 When to Use:
- Ideal for short, high-intensity laser sessions where fractionation starts strong and decreases over time.
- Useful when the laser-induced fractionation shows a rapid initial drop followed by stabilization.
3. Polynomial Fractionation Correction
🔹 Goal: This approach captures non-linear variations in fractionation by fitting a higher-order polynomial curve to the Pb/U ratio trend.
🔹 How It Works:
- Instead of assuming a straight-line or exponential behaviour, it uses a polynomial function (e.g., quadratic, cubic, etc.) to model complex fractionation trends.
- This method can correct for multiple shifts in fractionation behavior over the ablation duration.
- Higher-order polynomial fits allow for capturing more dynamic and irregular fractionation trends.
🔹 When to Use:
- Best for datasets where fractionation behaviour is irregular or does not follow a simple linear or exponential trend.
- Ideal for cases where fractionation varies in multiple directions (e.g., starts increasing, then stabilizes, then increases again).
Choosing the Right Fractionation Correction in Saturn 2.0
| Correction Type | Best For | Trend Assumption |
|---|---|---|
| Linear | Gradual, stable fractionation | Straight-line change over time |
| Exponential | Fast-changing fractionation at the start | Rapid initial change, then stabilizing |
| Polynomial | Irregular fractionation patterns | Complex, multi-directional changes |
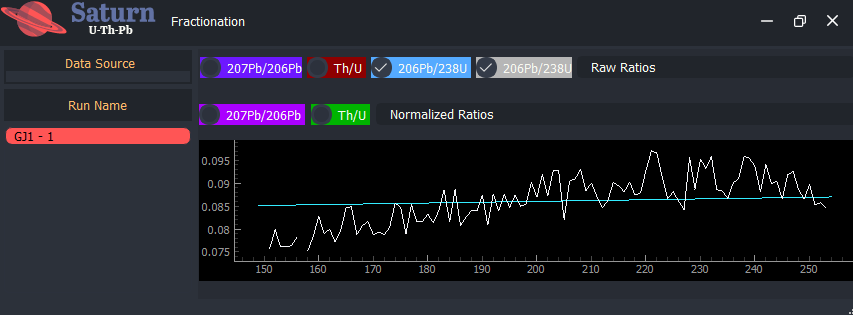
Key Features of the Fractionation Window:
- Data Source and Run Name: The top of the Fractionation window allows you to select a specific data source and run name to focus on a particular sample or analysis.
- Isotopic Ratio Options: You can select different isotopic ratios (e.g., 207Pb/206Pb, Th/U, 206Pb/238U) to visualize, allowing you to monitor changes in each ratio across the measurement sequence.
- Normalized Ratios Plot: This graph shows the selected isotopic ratio as a function of time or scan sequence, displaying how fractionation changes during the analysis. The trend line helps you see if the fractionation is stable, increasing, or decreasing, which can guide your choice of fractionation correction.
Using this window, you can evaluate whether linear, exponential, or polynomial correction would best address the observed fractionation trend, ensuring that your corrected data accurately represents the true isotopic composition of your samples.
For fractionation correction in U-Pb Saturn, the four options likely involve the following:
- No Correction: The raw data is used as-is without any adjustment for fractionation effects.
- Linear Correction: Applies a simple linear model, assuming that the fractionation effect changes consistently over time or across the dataset.
- Exponential Correction: Models the fractionation as an exponential decay or growth, accounting for non-linear trends that follow a specific exponential pattern.
- Polynomial Correction: Fits a polynomial curve to the fractionation data, capturing more complex, non-linear fractionation effects with greater flexibility.
U-Pb dating of carbonate rocks
Dating calcite via Laser Ablation Inductively Coupled Plasma Mass Spectrometry (LA-ICP-MS) offers several key advantages, making it a transformative tool in geochronology. This technique allows for in-situ U-Pb dating, preserving the textural and paragenetic context of calcite, which is critical for interpreting diagenetic and sedimentary processes. Its high spatial resolution enables precise targeting of specific calcite generations, such as syn-depositional or diagenetic phases, minimizing the influence of later alterations or mixed isotopic signals. LA-ICP-MS is particularly valuable for dating sedimentary records in terrestrial environments, where traditional volcanic ash-based methods may be limited or absent. Additionally, the technique’s ability to analyze small sample volumes reduces the need for extensive sample preparation, enhancing efficiency and preserving rare or delicate materials. By providing absolute ages for carbonate formations, LA-ICP-MS expands the potential to investigate depositional histories, paleoenvironments, and diagenetic processes, contributing significantly to our understanding of Earth’s geological history. Its versatility in dating diverse carbonate-bearing systems further underscores its importance in refining chronologies, particularly in stratigraphic sequences with complex or incomplete records.
Dating calcite via Laser Ablation Inductively Coupled Plasma Mass Spectrometry (LA-ICP-MS) is best accomplished using the U-Pb Saturn software, which significantly enhances the workflow with its intuitive, user-friendly interface and robust suite of analytical tools. U-Pb Saturn streamlines the entire data processing pipeline, from fractionation corrections and isotopic ratio calculations to visualizing and interpreting results. The software’s advanced plotting capabilities enable users to generate detailed concordia diagrams, isochron plots, and heatmaps, facilitating the interpretation of complex U-Pb data. Its interactive features allow for easy identification of outliers, refinement of datasets, and the ability to overlay contextual paragenetic information. By integrating customizable visualization options with cutting-edge algorithms for data reduction and uncertainty propagation, U-Pb Saturn provides unparalleled precision and clarity in geochronological analyses. This combination of powerful tools and user-centric design makes it an essential platform for researchers aiming to harness the full potential of LA-ICP-MS for calcite dating, ensuring reliable and publication-ready results with ease.
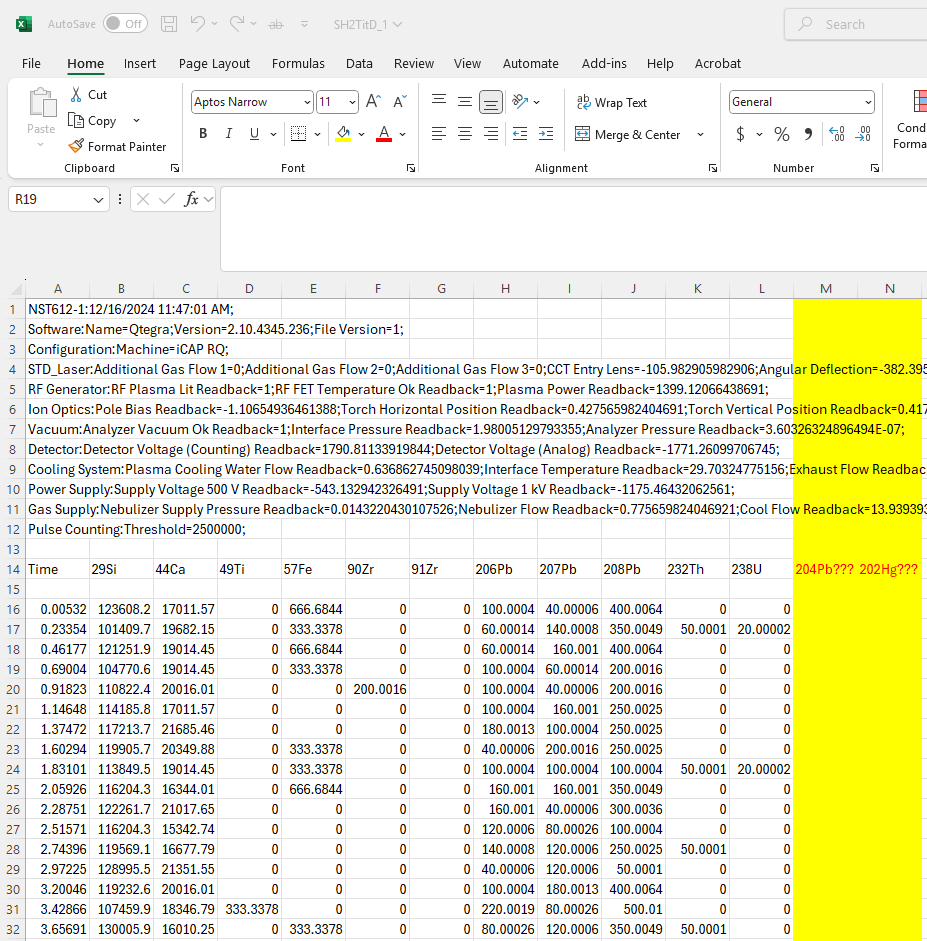
U-Pb Saturn: Advanced Data Handling for U-Pb Geochronology
U-Pb Saturn is designed to process complex datasets in laser ablation U-Pb geochronology, integrating extra trace element measurements while maintaining precision. The software efficiently handles missing values, including absent ²⁰²Hg and ²⁰⁴Pb measurements, ensuring robust corrections and accurate isotopic calculations. With its advanced data processing capabilities, U-Pb Saturn streamlines age determinations, allowing researchers to analyze diverse datasets with confidence. Watch the video below the image for more info on handling complex datasets.
Saturn Windows 10 – Older Versions
SATURN FOR WINDOWS 8 AND 10
Version 1.1 https://www.dropbox.com/s/wfmnoor560k5pce/SATURN%20-%202022-10-13%20-%20WITHOUT%20CONSOLE.zip?dl=1
Version 1.2 – https://drive.google.com/file/d/16aFlmpsrv9dcM73sVSXeYpG3b1VcEdKB/view?usp=sharing
Version 1.3 – https://drive.google.com/file/d/1wOUwchTVpDynQM_58MgdrupGzGNKDlFM/view?usp=sharing
IMPORTANT TIPS:
1- SATURN DOES NOT NEED TO BE INSTALLED. JUST COPY THE FOLDER TO YOUR DESKTOP AND RUN IT.
2- WHEN LOADING SATURN FOR THE FIRST TIME, YOU WILL HAVE TO WAIT FOR 2 MINUTES FOR THE SOFTWARE TO GET STARTED
Saturn 1.0 Test Drive Files
U-Pb in Zircon analysed with a Neptune plus.
Here we used GJ 1 as the primary reference material. The certified reference values for GJ 1 are already loaded in the software. The secondary RM is the Plesovice zircon
After watching the video above you should try it yourself.
GJ 1 DATA FILES FOR DOWNLOAD
https://air.app.br/wp-content/uploads/2023/02/GJ-DATA.zip
U-Pb in Monazite analysed with an Element 2.
Here we used Vermillion Monazite as the primary reference material. The certified reference values for Vermillion are already loaded in the software.
Note that the procedure is the same as above. The big difference here is that we show that some of the RM analyses were not good due to small defects in the RM crystal. So we removed the faulty analyses to improve the data quality.
After watching the video above you should try it yourself.
Adding new reference material is easy and straightforward. Go to the Ref Material Tab, add the name plus the certified values on the reference material window and click ADD. You can remove by clicking on remove, and change by clicking on the existing ref material, and changing the certified values. Follow the video and try it with the dataset above.