
MASS SPECTROMETRY
Mass Spectrometry (MS) is an analytical technique used to measure the mass-to-charge ratio (m/z) of ions. It is a powerful tool for identifying the composition of a sample by detecting and quantifying different molecules or atoms based on their mass. MS is widely used in chemistry, biology, environmental science, and many other fields to analyze complex mixtures, determine molecular structures, and measure isotopic abundances.
====================================================================
Presentation for Download:
++++++++++++++++++++++++++++++++++++++++++++++++++++++++++++++++++++
Basic Principles of Mass Spectrometry:
- Ionization:
- In mass spectrometry, the sample is first converted into ions, because the mass spectrometer analyzes ions based on their mass-to-charge ratio (m/z). Several ionization methods are used depending on the type of sample:
- Electron Ionization (EI): Electrons are bombarded onto the sample molecules, knocking out electrons to create positive ions.
- Electrospray Ionization (ESI): This method creates ions from large molecules, like proteins or biomolecules, by spraying the sample in a fine mist under an electric field.
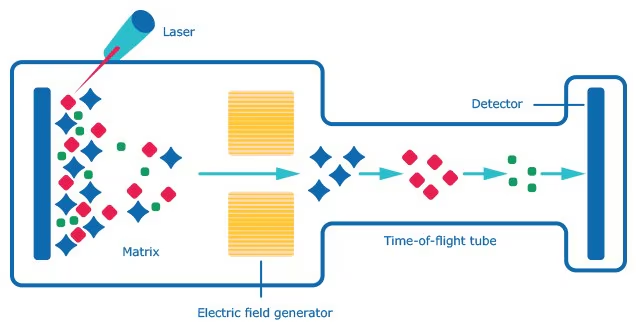
- Matrix-Assisted Laser Desorption/Ionization (MALDI): A laser is used to ionize large biomolecules from a solid matrix without breaking them into fragments.
- In mass spectrometry, the sample is first converted into ions, because the mass spectrometer analyzes ions based on their mass-to-charge ratio (m/z). Several ionization methods are used depending on the type of sample:
- Mass Analyzer:
- Once ionized, the ions are passed into the mass analyzer, which separates them according to their mass-to-charge ratio (m/z). Different types of mass analyzers are used depending on the resolution and sensitivity needed:
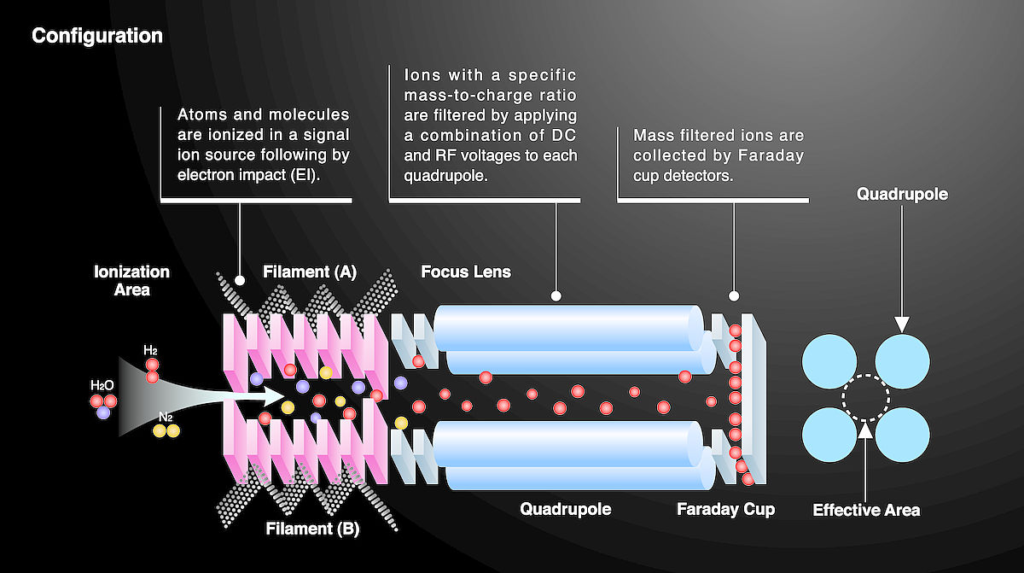
- Quadrupole: Uses oscillating electric fields to filter ions based on their m/z.
- Time-of-Flight (TOF): Measures the time ions take to travel a fixed distance; lighter ions reach the detector faster than heavier ones.
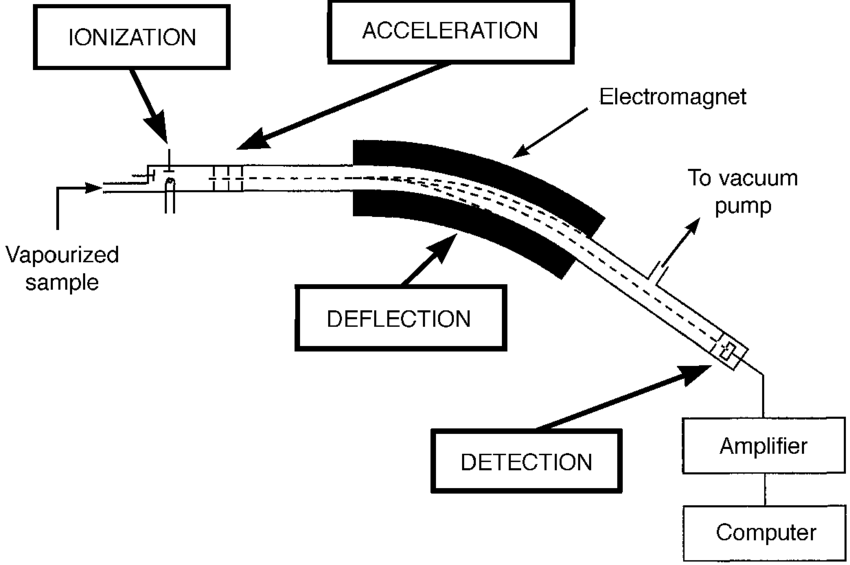
- Magnetic Sector: Uses a magnetic field to bend ion paths based on m/z, with heavier ions being deflected less than lighter ions.
- Ion Trap: Traps ions in an oscillating electric field, then ejects them for detection based on their m/z.
- Once ionized, the ions are passed into the mass analyzer, which separates them according to their mass-to-charge ratio (m/z). Different types of mass analyzers are used depending on the resolution and sensitivity needed:
- Detection:
- The separated ions are detected, typically by an electron multiplier, which converts ion impacts into an electrical signal. The signal strength corresponds to the abundance of each ion, allowing for both qualitative and quantitative analysis.
- Data Analysis:
- The mass spectrometer produces a mass spectrum, a graph where the x-axis represents the mass-to-charge ratio (m/z) and the y-axis shows the relative abundance of the detected ions. Each peak corresponds to ions of a specific m/z, and the height of the peak indicates the ion’s relative abundance.
Key Steps in a Mass Spectrometer:
- Sample Introduction: The sample is introduced into the mass spectrometer, usually in a gaseous form or vaporized for analysis.
- Ionization: The sample is ionized to form charged particles.
- Acceleration: The ions are accelerated through an electric field to give them kinetic energy.
- Mass Analysis: The ions are separated by their mass-to-charge ratio (m/z) in the mass analyzer.
- Detection: The ions are detected, and their abundance is measured.
- Data Interpretation: The resulting mass spectrum is analyzed to identify the components of the sample and quantify their amounts.
Types of Mass Spectrometry:
- Electrospray Ionization Mass Spectrometry (ESI-MS):
- Commonly used for analyzing large biomolecules (proteins, peptides, nucleotides). In this method, the sample is ionized in a liquid form by applying a high-voltage electric field, producing multiply charged ions.
- Matrix-Assisted Laser Desorption/Ionization Mass Spectrometry (MALDI-MS):
- MALDI is useful for analyzing large, fragile biomolecules such as proteins, peptides, and polymers. The sample is mixed with a matrix that absorbs laser energy, helping to ionize the molecules without breaking them into smaller fragments.
- Time-of-Flight Mass Spectrometry (TOF-MS):
- TOF mass spectrometers measure the time it takes ions to travel through a drift tube. Since lighter ions travel faster than heavier ones, TOF-MS can accurately measure the mass-to-charge ratio with high resolution.
- Quadrupole Mass Spectrometry:
- Quadrupole analyzers use oscillating electric fields to filter ions based on their mass-to-charge ratio. This technique is widely used for detecting and quantifying compounds in complex mixtures.
- Tandem Mass Spectrometry (MS/MS):
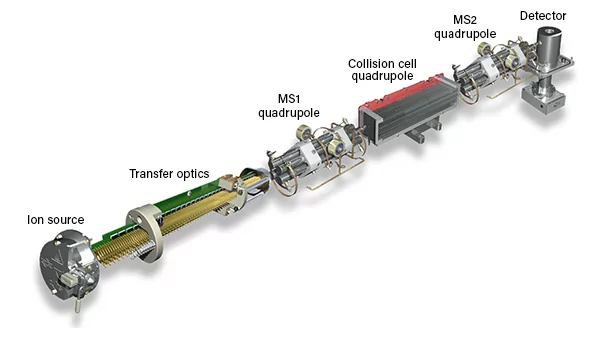
- Tandem mass spectrometry involves two stages of mass analysis. After the first stage (MS1), selected ions are fragmented, and the fragments are analyzed in the second stage (MS2). This method is used for structural elucidation of complex molecules, such as peptides and small organic compounds.
- Ion Trap Mass Spectrometry:
- In ion trap instruments, ions are confined in a dynamic electric field. By adjusting the field, ions are released sequentially according to their mass-to-charge ratio, allowing for selective detection of specific ions.
Applications of Mass Spectrometry:
- Proteomics and Biochemistry:
- MS is widely used for identifying and characterizing proteins and peptides. It helps in understanding protein structures, post-translational modifications, and protein interactions. ESI-MS and MALDI-MS are particularly useful in proteomics for sequencing and characterizing biomolecules.
- Pharmaceuticals and Drug Development:
- In drug development, MS is used for identifying drug metabolites, quantifying pharmaceutical compounds, and monitoring purity in drug manufacturing. LC-MS (Liquid Chromatography-Mass Spectrometry) is frequently used to separate and identify drug components in complex mixtures.
- Environmental Analysis:
- MS is employed to detect and quantify pollutants, such as pesticides, heavy metals, and organic contaminants, in environmental samples. Gas Chromatography-Mass Spectrometry (GC-MS) is commonly used for analyzing volatile organic compounds (VOCs) and other pollutants.
- Forensics:
- MS is a critical tool in forensic science for detecting and identifying substances in biological fluids, drugs, explosives, and toxins. It is used to analyze crime scene evidence, toxicology samples, and trace evidence.
- Isotope Ratio Mass Spectrometry (IRMS):
- IRMS is used to measure the relative abundance of isotopes in a sample. It is widely used in geochemistry, archaeology, and climate science to study isotope variations in natural materials, which can provide insights into environmental conditions and biological processes.
- Metabolomics:
- MS is used in metabolomics to analyze metabolites in biological samples. By studying metabolite profiles, researchers can understand metabolic pathways, diagnose diseases, or monitor therapeutic interventions.
- Petroleum and Petrochemical Analysis:
- MS is employed to characterize complex hydrocarbon mixtures, identify unknown compounds in crude oil, and determine the composition of fuels and lubricants.
- Food Safety and Quality Control:
- MS is used to detect contaminants, such as pesticides, additives, and adulterants, in food products. It also plays a role in verifying food authenticity and quality control.
Advantages of Mass Spectrometry:
- High Sensitivity: MS can detect trace amounts of compounds, making it useful for analyzing low-concentration samples.
- High Specificity: It can identify and differentiate between molecules that are chemically similar or have similar molecular weights.
- Quantitative and Qualitative Analysis: MS provides both qualitative identification and quantitative measurement of the compounds in a sample.
- Versatility: MS can analyze a wide range of sample types, including gases, liquids, and solids, making it applicable in various fields.
- Coupling with Other Techniques: MS can be coupled with separation techniques like chromatography (GC-MS, LC-MS) for enhanced analysis of complex mixtures.
ICP MS INSTRUMENTS
ICP-MS (Inductively Coupled Plasma Mass Spectrometry) is a powerful analytical technique used to detect trace elements and isotopic compositions in various types of samples. The instrument operates in several stages:
How does it work?
- Sample Introduction: The sample, often in liquid form, is introduced into the ICP-MS through a nebulizer, which creates an aerosol or fine mist. For solid samples, laser ablation systems are often used to directly vaporize material for analysis (as is common in your work with LA-ICP-MS).
- Ionization via Inductively Coupled Plasma (ICP): The aerosol is transported into a high-temperature plasma, typically generated by argon gas heated to around 6000–10,000 K by an inductively coupled radiofrequency (RF) coil. In this plasma, the sample is atomized and ionized, meaning the atoms lose electrons and become charged ions.
- Mass Separation: After ionization, the ions are directed into the mass spectrometer, where they are separated based on their mass-to-charge ratio (m/z). A quadrupole mass analyzer, a time-of-flight analyzer, or a sector field analyzer can be used for this separation.
- Detection: The separated ions are detected by a detector, typically an electron multiplier, which counts the ions and produces a signal proportional to the ion concentration in the sample.
- Data Analysis: The instrument generates mass spectra, showing the abundance of ions as a function of their m/z. From this, the concentration of trace elements or isotopic ratios in the sample can be determined with high precision.
Watch the video below for more details on ICP MS
Key Components
1. Sample Introduction
In most routine ICP-MS analyses, the sample is introduced as a liquid using a nebulizer and spray chamber. The nebulizer uses supersonic expansion of gas to turn the liquid into a fine mist, and the spray chamber then removes any droplets that are too large to be processed in the plasma
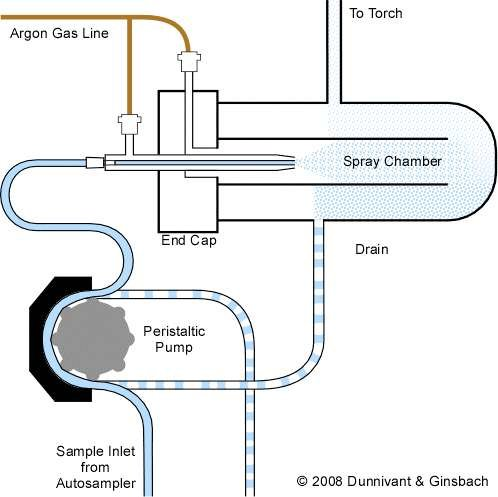
Here’s a breakdown of the components:
- Sample Inlet from Autosampler: The sample, typically a liquid solution, is introduced into the system through the inlet tube connected to an autosampler, which delivers samples in sequence.
- Peristaltic Pump: This pump drives the liquid sample from the autosampler into the system at a controlled and consistent flow rate. It uses rotating rollers to squeeze the sample through the tubing, preventing contamination.
- Spray Chamber: After the peristaltic pump, the sample enters the spray chamber. The spray chamber helps in removing larger aerosol droplets and only allows fine droplets to move forward. This is important to maintain stable and efficient sample transport into the plasma.
- Nebulizer: Just before entering the spray chamber, the sample solution is transformed into a fine aerosol using a nebulizer. The nebulizer uses argon gas (coming from the argon gas line) to assist in breaking up the liquid sample into small droplets.
2. Plasma Torch and Interface
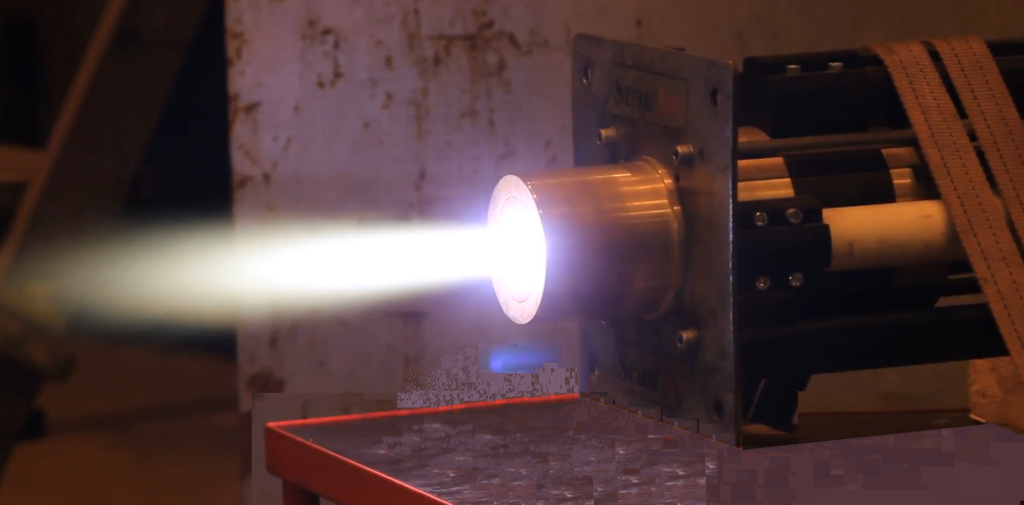
1. Plasma Torch
The plasma torch is a crucial part of the ICP-MS system where the sample undergoes ionization. The plasma is created using argon gas, which is subjected to a high-frequency electromagnetic field generated by a radio frequency (RF) coil. The plasma torch typically consists of three concentric tubes:
- Outer Tube: Supplies argon gas, which forms the plasma.
- Middle Tube: Guides the aerosol (sample in the form of fine mist) from the nebulizer and spray chamber into the core of the plasma.
- Inner Tube: Contains the high-temperature plasma (6000–10,000 K) generated by the RF field.
Plasma Formation:
- Argon gas is introduced into the torch and flows through the outer tube.
- An RF coil wrapped around the torch applies an oscillating electromagnetic field, which energizes the argon gas atoms, stripping electrons from them and forming a plasma – a highly ionized, electrically conductive gas.
- The plasma is sustained by the RF energy, and its temperature is high enough to atomize and ionize the aerosolized sample.
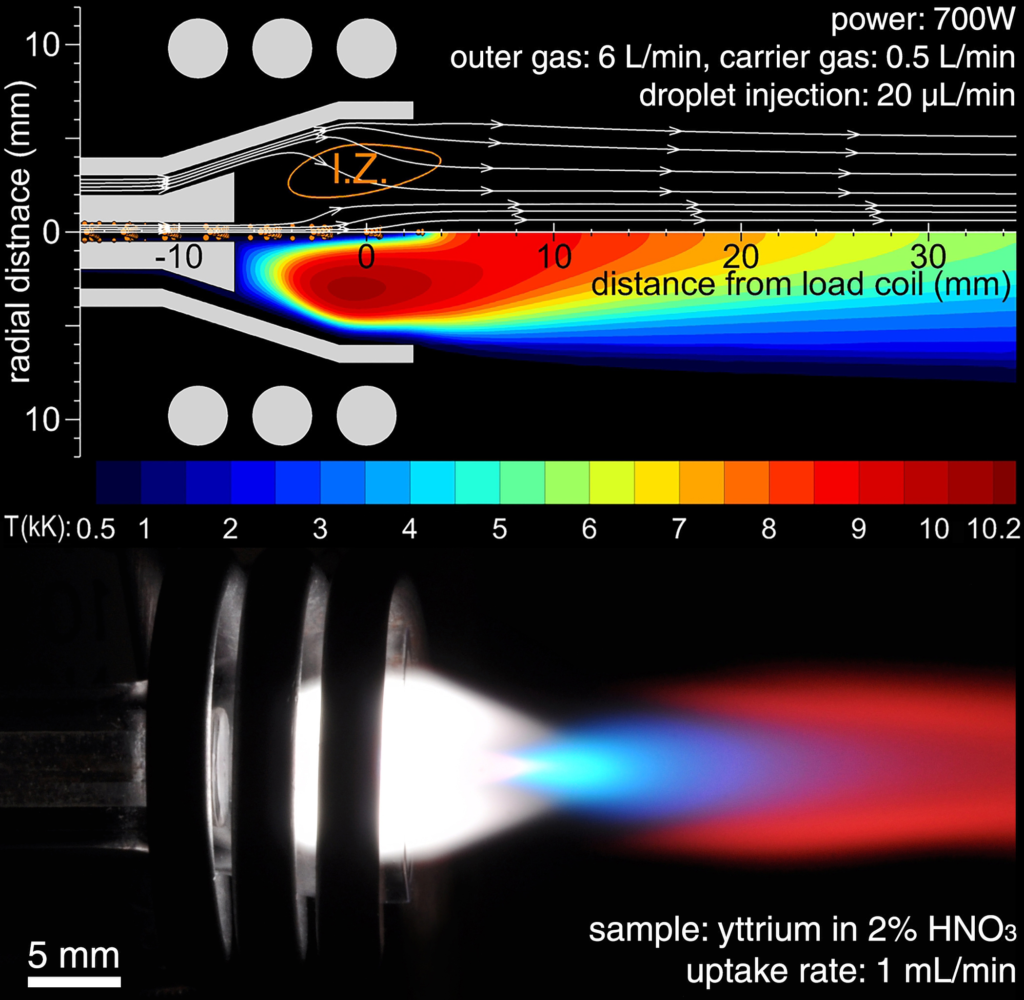
Sample Ionization:
- The aerosol sample, carried by argon gas, enters the plasma through the middle tube.
- In the plasma, the aerosol droplets are rapidly desolvated (the solvent is evaporated), leaving behind solid particles.
- These solid particles are then vaporized into atoms, which are further excited and finally ionized (electrons are stripped from the atoms) due to the high energy of the plasma.
- This process converts the atoms of the elements present in the sample into positively charged ions, which are necessary for mass spectrometric detection.
The plasma acts as both an atomization and ionization source, ensuring that the sample’s atoms are fully ionized and ready to be transferred into the mass spectrometer for analysis.
2. Ion Extraction
The plasma (containing ionized sample particles) is generated in the torch and confined by the plasma boundary. As the plasma expands, it creates shockwaves as it enters the lower-pressure region (via the sampler and skimmer cones). The barrel shockwave and Mach disc are features of this pressure transition. The ions are extracted into the sampler cone, which selects a small, focused portion of the plasma and transmits it to the next stage. The ions are then further refined as they pass through the skimmer cone, leaving behind any remaining neutral particles and gases, thus generating a well-defined ion beam. This ion beam is directed into the mass spectrometer, where it will be separated based on the mass-to-charge ratio (m/z) for detection and analysis.
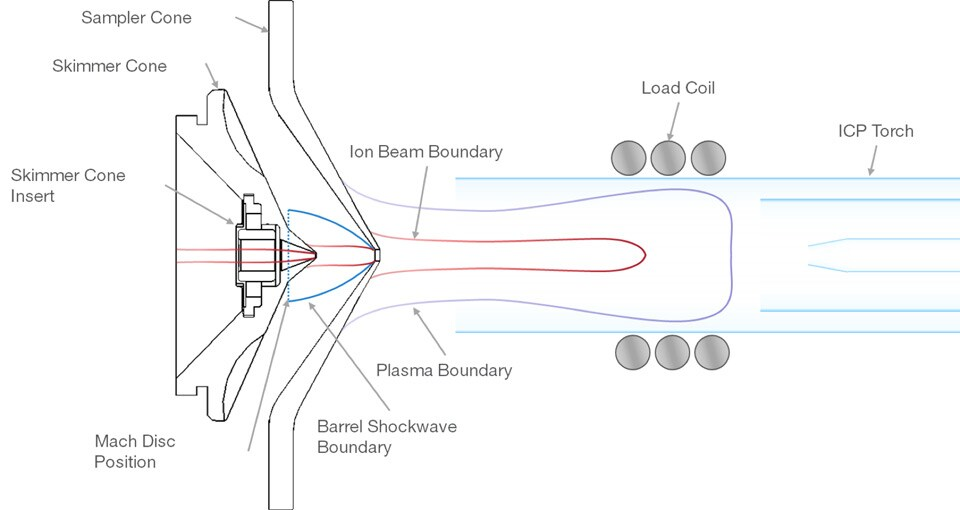
Once the sample is ionized in the plasma, the next step is extracting the ions and guiding them into the mass spectrometer for analysis. This is accomplished through the following steps:
Interface Region:
- After the sample is ionized in the plasma, the positively charged ions need to be extracted from the plasma (which is at atmospheric pressure) into the vacuum of the mass spectrometer (which operates under very low pressure). The interface region achieves this by allowing the ions to pass through a series of conical metal discs (called sampler and skimmer cones).
Sampler Cone:
- The sampler cone is the first cone, positioned at the end of the plasma torch.
- The tip of this cone has a small orifice (~1 mm in diameter) that allows a small portion of the plasma, including the ions, to enter while most of the plasma and neutral species are discarded.
- The sampler cone helps in reducing the pressure from atmospheric levels to a low-pressure environment needed for ion extraction.
Skimmer Cone:
- After passing through the sampler cone, the ions and gas flow enter the second stage, where they pass through a second cone, the skimmer cone.
- The skimmer cone further reduces the pressure, creating a high vacuum that is required for mass spectrometric analysis.
- Only the ions are selectively guided through the skimmer cone, while excess plasma gases and neutral species are pumped away.
Ion Lens System:
- After passing through the skimmer cone, the ions are focused by a set of electrostatic lenses or ion optics, which optimize the ion beam for entry into the mass analyzer. The lenses focus and accelerate the ions, reducing energy dispersion, and directing the ions to the mass spectrometer.
- These lenses also help remove any remaining neutral particles or photons that could interfere with the analysis.
Quadrupole Entrance:
- The ions are now in a focused beam and ready to enter the mass analyzer, which could be a quadrupole, time-of-flight, or sector field system depending on the instrument.
- The ion beam travels through the mass analyzer, where ions are separated by their mass-to-charge ratio (m/z), before finally reaching the detector.
3. Mass Analyser
The mass analyzer is one of the most critical components of an ICP-MS instrument, responsible for separating ions based on their mass-to-charge ratio (m/z). After the sample is ionized in the plasma torch and the ions are extracted through the interface (sampler and skimmer cones), the mass analyzer directs these ions to the detector, allowing precise quantification and identification of elements and isotopes.
Different types of mass analyzers are used in ICP-MS, and each works based on a specific principle to separate ions. Here’s a detailed breakdown of how mass analyzers work, focusing on the most common types used in ICP-MS.
Quadrupole mass analyser (Q-MS): Fast, cost-effective, and commonly used for routine elemental analysis, but lower mass resolution.
Time-of-Flight mass analyser (TOF): High resolution and ability to measure a wide range of masses, but more expensive and complex.
Sector-Field mass analyser (SF-MS): Extremely high resolution and ideal for isotopic analysis, but slow and expensive.

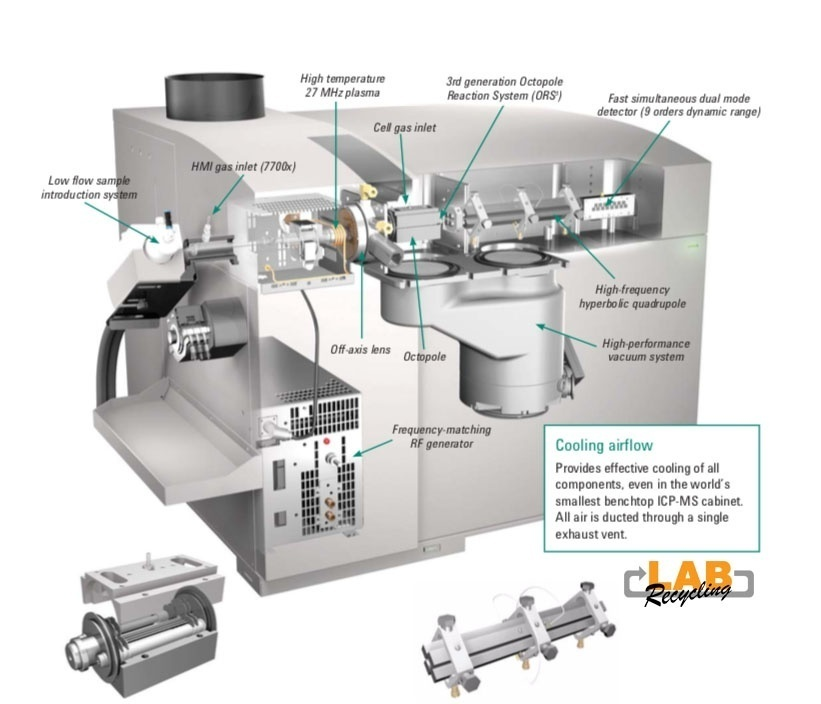
Triple Quadrupole mass analyser (QQQ): Excellent at interference removal with high sensitivity, but also more costly and complex.
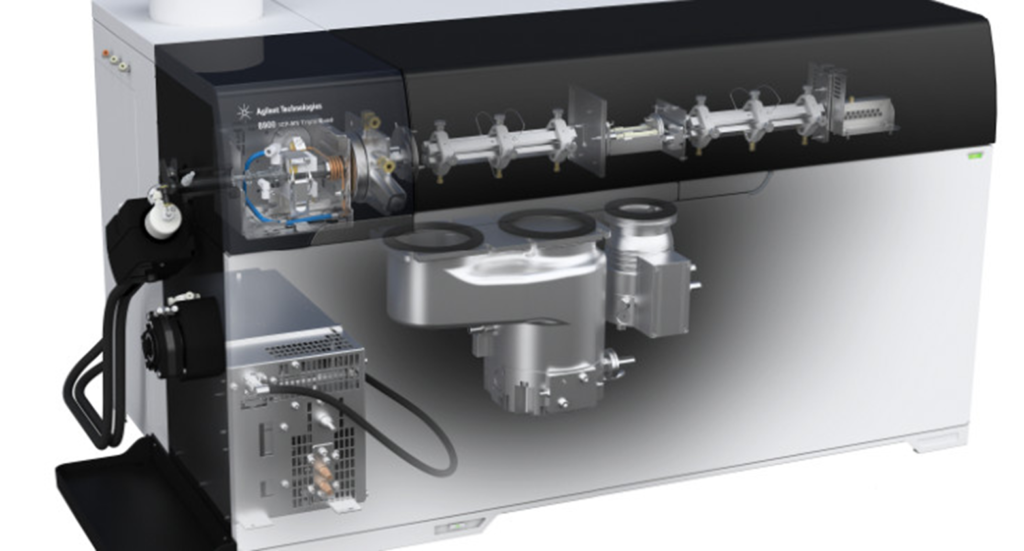
This image displays an ICP-MS (Inductively Coupled Plasma Mass Spectrometer) instrument, specifically an Agilent Technologies 8900 ICP-QQQ (Triple Quadrupole) system. The image shows various key components inside the ICP-MS and gives a cutaway view of the internal parts involved in the process. Here’s an explanation of its key parts and their functions:
WORKING WITH LASER ABLATION
TRACE ELEMENT DATA REDUCTION PART 1: OPEN SOFTWARE AND DOWNLOAD DATA
TRACE ELEMENT DATA REDUCTION PART 2: CHECK DATA QUALITY, SAVE PROJECT, EXPORT DATA AND PLOT IN EXCE
Exercise 1: Enter the data from BHVO, NIST, and
. Check the signal from each data point. Save the project and export the data in Excel format.
Use the following internal element standard:
BHVO => Si = 50; NIST => Si = 69; BCR2GB => Si = 54
Exercise 2: Open the Excel data and compare the averaged element concentrations for NIST, BHVO, and BCR2GB. After averaging, calculate the standard deviation from each of the materials and, based on the STD, decide which returned the best results.
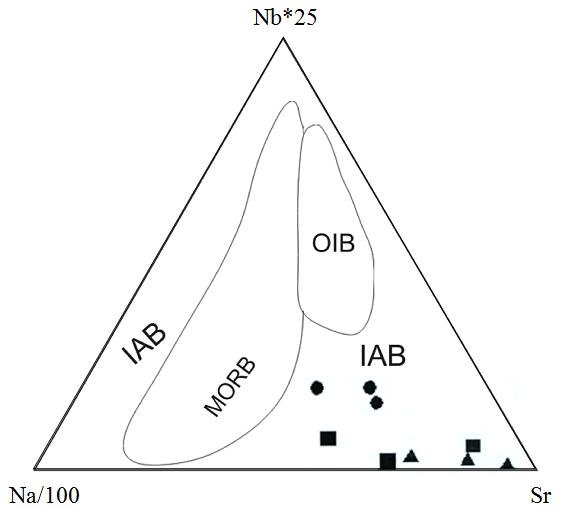
The triangular diagram above is a geochemical discrimination diagram often used to classify volcanic rocks based on their trace element composition, particularly in terms of tectonic settings. The axes represent different elemental ratios:
- left represents Sr (Strontium) content.
- top is Nb (Niobium) content (Nb * 25).
- right represents Na (Sodium) content divided by 100 (Na/100).
This triangular plot divides mafic rocks like BHVO and BCR into different fields based on their geochemical signatures:
- MORB: This field refers to Mid-Ocean Ridge Basalts, which are typical of oceanic spreading centers. These rocks have distinct trace element signatures, generally with low Nb and moderate Na and Sr values.
- IAB: This field refers to Island Arc Basalts, which are typically formed in subduction zones. These rocks are generally more enriched in Sr and depleted in Nb compared to other types of basalt.
- OIB: This field represents Ocean Island Basalts, which are typically found in volcanic islands away from tectonic plate boundaries. These rocks are often enriched in Nb compared to MORB and IAB.
The points within the diagram represent individual rock samples, and their position helps to infer their tectonic setting:
- Circles, squares, and triangles represent different samples plotted in the IAB field, indicating that they are likely related to subduction zone processes (island arc volcanism).
Exercise 3: Plot data from BHVO and BCR in the triangle diagram and let us know which group of basalts they belong to.
TRACE ELEMENT DATA REDUCTION PART 3: MAKING PLOTS WITH THE SOFTWARE
U-Pb DATA REDUCTION WITH U-Pb SATURN