
WORKING WITH XRF DATA
PRACTICAL EXERCISES
EXERCISE 1: Mineral Chemistry:
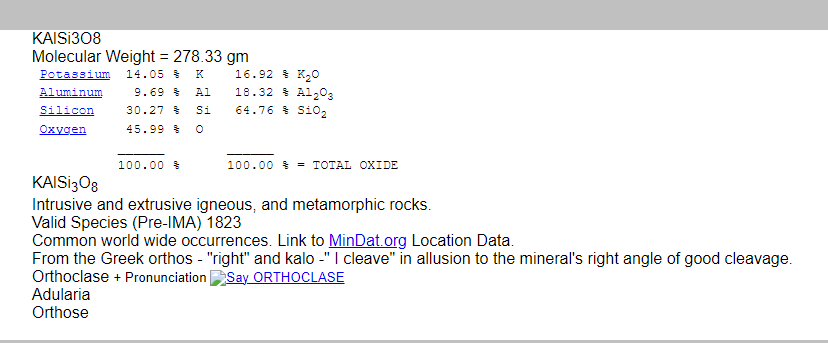
The chemistry of the material analysed by XRF can be presented in different forms. Here is a breakdown of the composition of the mineral orthoclase (shown in the figure below), which is an end-member alkali feldspar with the chemical formula KAlSi₃O₈. The image below also shows a mineral aggregate of feldspar, possibly orthoclase (KAlSi₃O₈), with other associated minerals such as quartz. Feldspar is often found in such clusters with blocky or tabular crystals, and its colour can range from white to pinkish, as seen here. The pink hue suggests the presence of orthoclase, a common potassium feldspar, often found in granite and other igneous rocks.
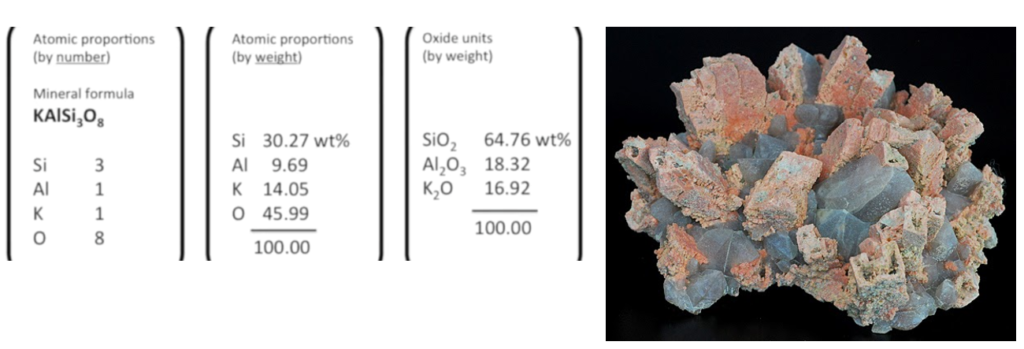
The information in the table above is presented in three formats:
- Atomic proportions by number:
- The mineral formula shows the ratio of atoms in orthoclase:
- Si (Silicon): 3
- Al (Aluminum): 1
- K (Potassium): 1
- O (Oxygen): 8
- The mineral formula shows the ratio of atoms in orthoclase:
- Atomic proportions by weight:
- The weight percentage of each element in orthoclase is provided:
- Si (Silicon): 30.27 wt%
- Al (Aluminum): 9.69 wt%
- K (Potassium): 14.05 wt%
- O (Oxygen): 45.99 wt%
- The weight percentage of each element in orthoclase is provided:
- Oxide units by weight:
- The composition in terms of oxide weight percentages:
- SiO₂ (Silicon dioxide): 64.76 wt%
- Al₂O₃ (Aluminum oxide): 18.32 wt%
- K₂O (Potassium oxide): 16.92 wt%
- The composition in terms of oxide weight percentages:
This breakdown gives a complete representation of orthoclase’s chemical composition both in terms of atomic and oxide proportions, making it useful for understanding the mineral’s structure and chemistry in geological contexts.
Before we go into more detail about the different representations of K-feldspar composition we will have a look at Microprobe data for K-Feldspar and Plagioclase.
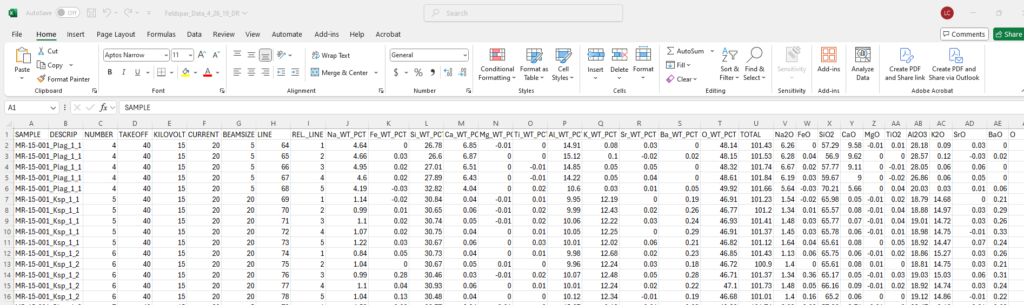
Data table with results from a microprobe analysis, likely an electron microprobe used for the quantitative analysis of minerals. Here’s a breakdown of the columns:
- SAMPLE: The sample identification, such as “MR-15-001,” appears to represent a specific mineral or sample being analyzed.
- DESCRIP: Describes the specific mineral being analyzed, such as “Plag” for plagioclase and “Ksp” for potassium feldspar.
- NUMBER: This likely represents the individual analysis or spot number on the sample.
- TAKEOFF, KILOVOLT, CURRENT, BEAMSIZE, LINE: These columns represent the operating conditions of the microprobe, such as the takeoff angle, accelerating voltage (kilovolts), current (likely in nanoamps), beam size in micrometers, and line number of the analysis.
- REL_LINE: This could be a relative line number or another reference point for a set of analyses.
- Columns J to T contain the weight percent (WT_PCT) of various elements or oxides measured in the sample. These include:
- Na_WT_PCT (J): Sodium as Na₂O in weight percent.
- Fe_WT_PCT (K): Iron as FeO or Fe₂O₃ in weight percent.
- Si_WT_PCT (L): Silicon as SiO₂ in weight percent.
- Ca_WT_PCT (M): Calcium as CaO in weight percent.
- Mg_WT_PCT (N): Magnesium as MgO in weight percent.
- Ti_WT_PCT (O): Titanium as TiO₂ in weight percent.
- Al_WT_PCT (P): Aluminum as Al₂O₃ in weight percent.
- K_WT_PCT (Q): Potassium as K₂O in weight percent.
- Sr_WT_PCT (R): Strontium in weight percent.
- Ba_WT_PCT (S): Barium in weight percent.
- O_WT_PCT (T): Oxygen content in weight percent, likely calculated based on the oxides.
- TOTAL: The total of all measured oxide concentrations, which is typically close to 100%, accounting for all major and minor elements.
- Other columns (V-AE): List additional oxide concentrations for major and minor elements such as Na₂O, FeO, SiO₂, CaO, MgO, TiO₂, Al₂O₃, K₂O, SrO, and BaO. These oxides are typically measured in minerals during microprobe analysis to understand their composition.
The data focus on feldspar minerals (plagioclase and potassium feldspar) based on the descriptors and oxide content, which are common targets in geological and mineralogical studies.
________________________________________________________________________________________________________________
Now that we are familiar with mineral data from either Electron Microscopes or Mircroprobes, let’s see how we convert from one representation to another: just follow the steps below.
________________________________________________________________________________________________________________
HOW TO CONVERT ATOMS BY NUMBERS TO ATOM/OXIDE BY WEIGHT PER CENT

Please follow the instructions given by Dr Arjan Dijkstra in one of the videos at the bottom of this page.
Before we start, take a very close look at the diagram below:
_______________________________________________________________________________________________________________
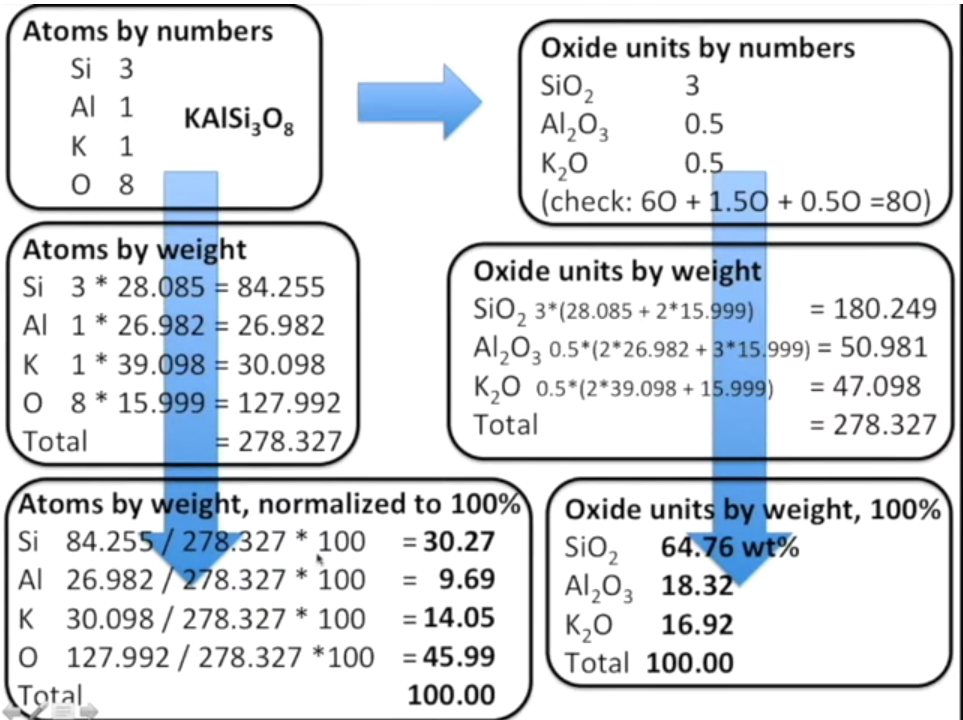
The conversion from atomic proportions to oxide weight percentages follows the simple sequence of calculations:
- Atoms by Numbers:
- Si: 3
- Al: 1
- K: 1
- O: 8 These represent the stoichiometry of the feldspar formula KAlSi₃O₈.
- Atoms by Weight: This converts the number of atoms into their respective masses using their atomic weights:
- Si: 3 * 28.085 = 84.255
- Al: 1 * 26.982 = 26.982
- K: 1 * 39.098 = 30.098
- O: 8 * 15.999 = 127.992 Total = 278.327
- Atoms by Weight, Normalized to 100%: This section normalizes the atomic weights to percentages:
- Si: 30.27%
- Al: 9.69%
- K: 14.05%
- O: 45.99% Total = 100%
- Oxide Units by Numbers: This shows how the atomic numbers are translated into oxide molecules:
- SiO₂: 3
- Al₂O₃: 0.5
- K₂O: 0.5
- Oxide Units by Weight: This calculates the molecular weights for each oxide:
- SiO₂: 180.249
- Al₂O₃: 50.981
- K₂O: 47.098 Total = 278.327
- Oxide Units by Weight, Normalized to 100%: This normalizes the oxide weights:
- SiO₂: 64.76 wt%
- Al₂O₃: 18.32 wt%
- K₂O: 16.92 wt% Total = 100%
This kind of calculation is typical in geochemistry for determining the mineral composition in oxide terms, often used for classifying igneous rocks and determining mineral formulae.
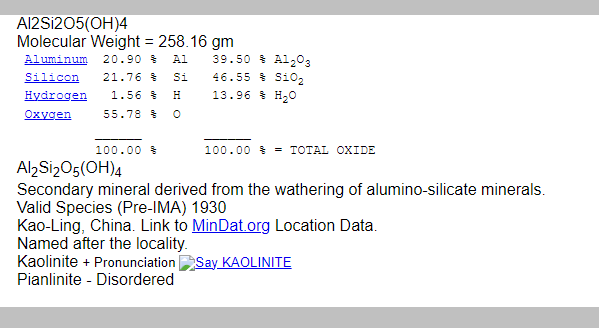
LET’S DO THE SAME FOR KAOLINITE
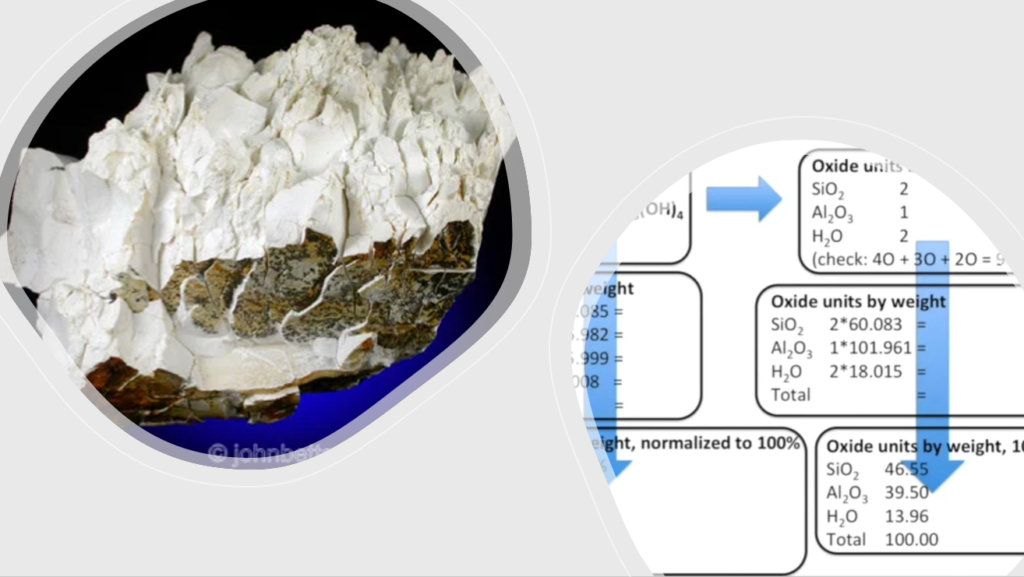
Now check the compositions of K-feldspar and Kaolinte below:
________________________________________________________________________________________________________________
________________________________________________________________________________________________________________
EXERCISE 2: UNDERSTANDING WHOLE ROCK ANALYSES
For rock composition the elemental information is given in the table below:
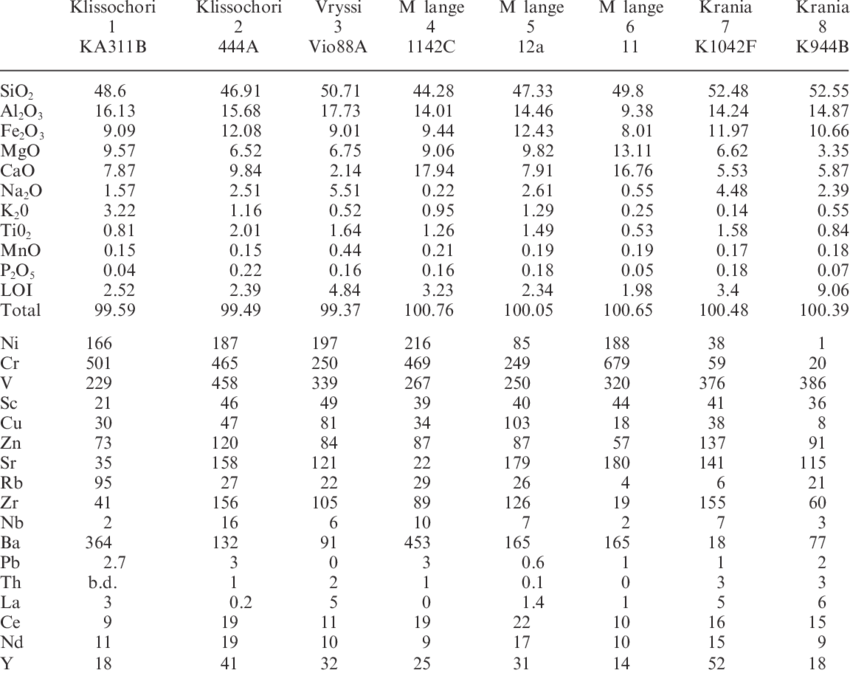
The table presents the chemical compositions of different rock samples, likely from various geological settings or rock types. The columns correspond to different sample names (e.g., Klutschon 1, Klutschon 2, Wysi 3), and the rows list the major oxides and trace elements measured for each sample.
Key Observations:
- Major Oxides:
- Oxides such as SiO₂, Al₂O₃, Fe₂O₃, MgO, Na₂O, and K₂O are presented as percentages by weight. These oxides are the main components of silicate rocks, influencing the classification of the samples.
- For example, SiO₂ content ranges from approximately 44% to 52%, indicating silicate-rich samples.
- The total oxides for each sample sum up to around 100%, which confirms the completeness of the analysis.
- Trace Elements:
- Elements such as Ni (Nickel), Cr (Chromium), Zn (Zinc), Sr (Strontium), Ba (Barium), and Pb (Lead) are measured in parts per million (ppm).
- The trace element concentrations vary between samples, with some elements like Cr and Ni showing relatively high concentrations in certain samples (e.g., Klutschon 2 and Wysi 3).
- LOI (Loss on Ignition):
- LOI values are provided for each sample, indicating the percentage of mass lost upon heating. This is important for understanding volatile components, such as water or carbonates, present in the samples.
Overall, the table shows a detailed breakdown of both major and trace element compositions, which could be used for geochemical classification, comparison between different rock types, or understanding the geological processes that formed these samples.
—————————————————————————————————————–
MAKING INTERPRETATIONS FROM WHOLE ROCK DATA:
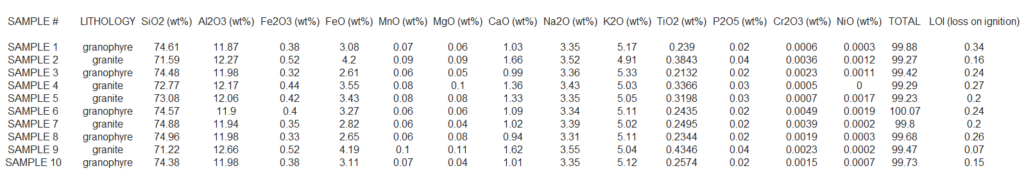
Here is a table showing whole rock analyses via XRF. Let’s analyse the chemical composition of this rock and find out what information we can extract from the XRF data.
How do we go about it?
We have data for 10 different rock samples, identified by their lithology (rock type), and the concentrations of various oxides and elements expressed as weight percentages (wt%). The table includes the following key columns:
- Sample #: The identifier for each sample, ranging from 1 to 10.
- Lithology: The type of rock, including “granophyre” and “granite.”
- SiO₂ (wt%): The percentage of silicon dioxide, a major component in felsic rocks like granite.
- Al₂O₃ (wt%): Aluminum oxide, is another major component of silicate minerals in these rocks.
- Fe₂O₃ and FeO (wt%): Total and ferrous iron oxides, which can indicate the redox state of the rock.
- MnO, MgO, CaO (wt%): Oxides of manganese, magnesium, and calcium, representing trace or minor elements.
- Na₂O and K₂O (wt%): Sodium and potassium oxides, typically found in feldspars and important in classifying the rocks as felsic.
- TiO₂, P₂O₅, Cr₂O₃, NiO (wt%): Oxides of titanium, phosphorus, chromium, and nickel, generally present in trace amounts.
- Total: The sum of all the major oxides, typically expected to be around 100% in most analyses.
- LOI (Loss on Ignition): The weight loss upon heating the sample, which provides information about volatile components like water or carbonates.
The data shows variability across the samples in terms of SiO₂ content, K₂O, Na₂O, and other oxides, indicating slight differences in the chemical composition of granophyre and granite. This type of geochemical analysis is essential in petrology for classifying and understanding the formation and evolution of igneous rocks.
Whole work data is generally used to make elemental correlations to understand the nature and origin of the rocks. We can also classify the rocks using the chemical composition of the rocks. For example diagrams (see below)
What kind of interpretations can we make?
Let’s break down the table’s data more specifically, focusing on the differences between the granophyre and granite samples, and highlighting key elements and trends.
1. SiO₂ (Silicon Dioxide) Content:
- Granophyre (Samples 1, 3, 6, 8, 10) has SiO₂ ranging from 74.34% to 74.96%, which indicates these rocks are very silica-rich, typical of felsic rocks.
- Granite (Samples 2, 4, 5, 7, 9) has SiO₂ ranging from 71.22% to 73.08%, slightly lower than granophyre, but still within the range of felsic rocks.
- Overall, both rock types are silica-rich, but granophyre appears slightly more silica-enriched than granite.
2. Al₂O₃ (Aluminum Oxide) Content:
- Both granophyre and granite have similar Al₂O₃ concentrations, ranging between 11.87% and 12.27%. Aluminum oxide is a major component of feldspars, which are abundant in these rock types.
3. Fe₂O₃ (Ferric Iron Oxide) and FeO (Ferrous Iron Oxide) Content:
- Granophyre: Fe₂O₃ ranges from 0.33% to 0.38% and FeO from 2.61% to 3.27%.
- Granite: Fe₂O₃ ranges from 0.44% to 0.52% and FeO from 2.45% to 3.61%.
- While Fe₂O₃ (oxidized iron) content is low in both rock types, FeO (reduced iron) is slightly higher in granite, which might indicate a different oxidation environment during rock formation.
4. Alkali Oxides (Na₂O and K₂O):
- Na₂O (Sodium Oxide):
- Granophyre: Ranges from 3.29% to 3.52%.
- Granite: Ranges from 3.05% to 3.65%.
- Sodium oxide levels are quite comparable between the two rock types.
- K₂O (Potassium Oxide):
- Granophyre: Ranges from 5.05% to 5.33%, indicating a relatively high potassium content.
- Granite: Ranges from 4.91% to 5.30%, also showing high K₂O levels but slightly lower than granophyre.
- High potassium content is indicative of the presence of potassium feldspar, a common mineral in both rock types, but granophyre appears to be slightly more potassium-rich.
5. Trace Oxides (MnO, MgO, TiO₂, P₂O₅, Cr₂O₃, NiO):
- These oxides occur in trace amounts and do not show large variability between the two lithologies. For example:
- MnO: Ranges from 0.07% to 0.08% in both rock types.
- TiO₂ (Titanium Oxide): Ranges from 0.213% to 0.434%; granite shows slightly higher values.
- P₂O₅ (Phosphorus Pentoxide): A minor oxide ranging from 0.02% to 0.04%.
- Cr₂O₃ and NiO levels are extremely low (less than 0.005%), indicating minimal chromium and nickel content, which is typical for felsic rocks.
6. Total Oxides and LOI (Loss on Ignition):
- The Total sum of oxides for most samples is close to 100%, ranging from 99.27% to 100.07%, which is expected in high-quality geochemical analysis.
- LOI (Loss on Ignition) represents volatile content (water, carbonates, etc.) lost when the sample is heated. The LOI values range from 0.15% to 0.34%, which indicates a relatively low amount of volatiles in these samples, common for fresh, unaltered igneous rocks.
Comparative Insights:
- Granophyre tends to have slightly higher SiO₂ and K₂O than granite, making it more silica-rich and potassium-enriched.
- Granite shows a broader range of FeO content, suggesting variable redox conditions during its formation.
- Both rock types have similar amounts of Al₂O₃ and Na₂O, reflecting their common mineralogical components like feldspar.
- Trace elements like MnO, TiO₂, and P₂O₅ are present in low but comparable amounts in both lithologies.
Interpretation:
These analyses suggest that both granophyre and granite are felsic igneous rocks with high silica content, typical of rocks formed from highly evolved magmas. The slight variations in iron oxide contents and alkali oxides could indicate differences in their crystallization histories or source materials. Granophyre, with its slightly higher silica and potassium content, might have crystallized under slightly different conditions or from a more evolved magma compared to the granite.
________________________________________________________________________________________________________________
________________________________________________________________________________________________________________
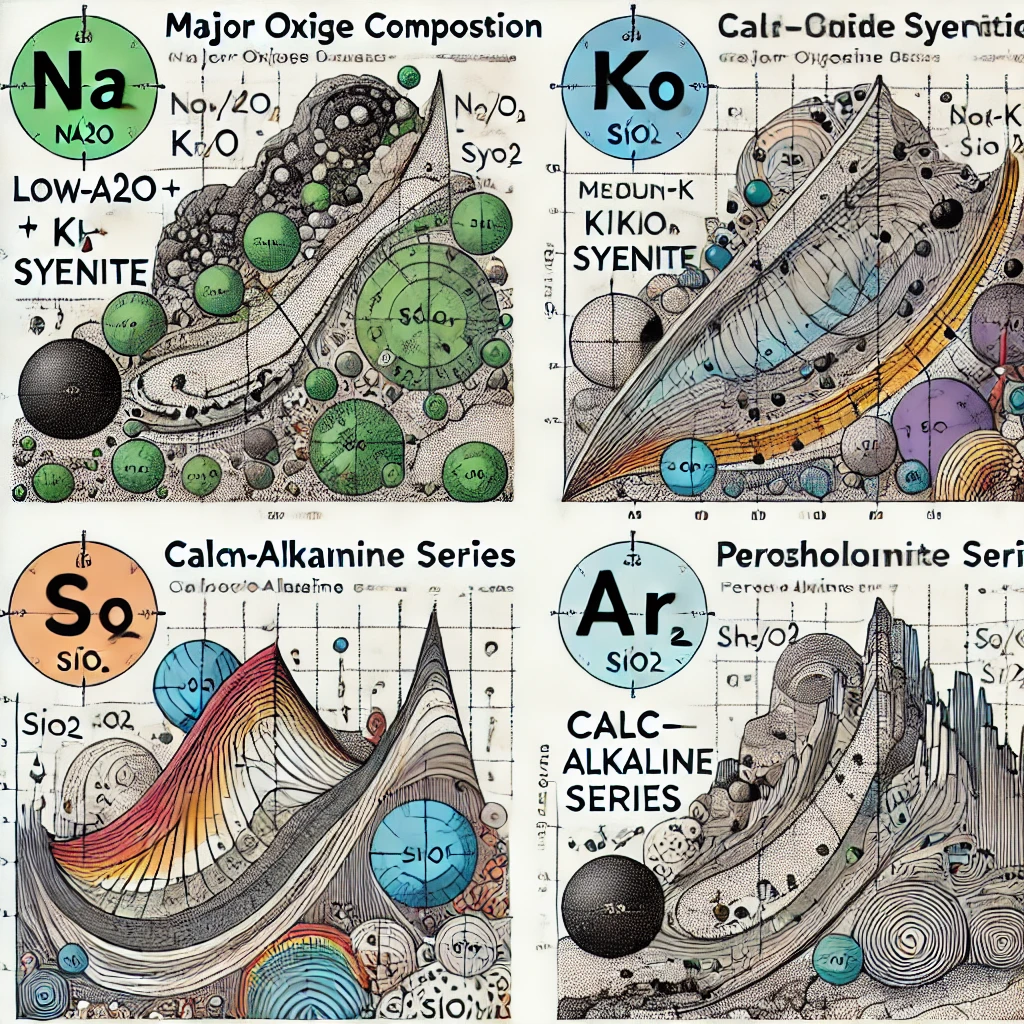
EXERCISE 3: READING GEOCHEMICAL PLOTS
Let’s consider the Geochemical Plots below:
How can we read these plots?
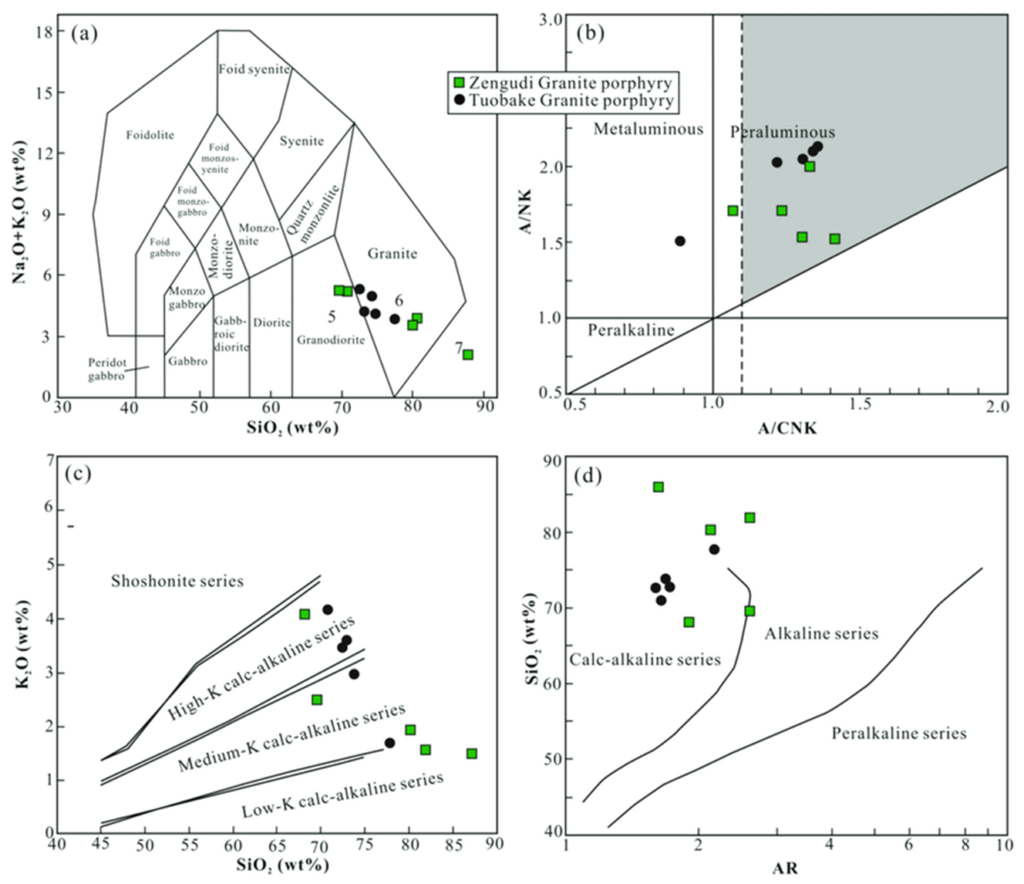
Panel (a): Total Alkali-Silica (TAS) Diagram
- This plot shows Na₂O + K₂O (total alkalis) on the y-axis and SiO₂ (silica content) on the x-axis.
- Rocks are classified based on their alkali and silica content, which helps identify their magmatic affinity.
- The rock types (like granite, syenite, foid syenite, and monzodiorite) are outlined in different regions.
- The green squares (Zengudi Granite porphyry) and black circles (Tuobake Granite porphyry) indicate where specific samples plot in the granite field, suggesting these samples are high in silica and alkalis, typical of granitic compositions.
Panel (b): Alumina Saturation Index (ASI) Diagram
- This plot shows A/NK (the ratio of Al₂O₃ to Na₂O + K₂O) on the y-axis and A/CNK (the ratio of Al₂O₃ to CaO + Na₂O + K₂O) on the x-axis.
- It classifies rocks as peraluminous, metaluminous, or peralkaline, which provides insight into the source material of the magma and its evolution.
- Peraluminous rocks have more aluminum than needed to form feldspar and often contain aluminous minerals like muscovite.
- Metaluminous rocks have balanced aluminum and alkalis.
- Peralkaline rocks have excess alkalis relative to aluminum.
- The green squares and black circles fall within the metaluminous and peraluminous fields, indicating that these granites are typically either slightly aluminum-rich or balanced in alkali and aluminum.
Panel (c): K₂O vs SiO₂ Diagram
- This plot shows K₂O (potassium oxide) on the y-axis and SiO₂ on the x-axis.
- The diagram differentiates between low-K, medium-K, high-K calc-alkaline series, and the shoshonite series.
- The samples represented by green squares and black circles are mostly in the high-K calc-alkaline series, indicating a high potassium content relative to silica, typical of many continental granitic rocks.
- The calc-alkaline series is indicative of magmas that have undergone significant differentiation, often associated with subduction zone environments.
Panel (d): SiO₂ vs AR Diagram (Alkali-Ratio)
- This plot shows SiO₂ on the y-axis and the Alkali Ratio (AR) on the x-axis.
- The diagram divides rocks into calc-alkaline, alkaline, and peralkaline series.
- Calc-alkaline series rocks are typical of volcanic arcs and subduction zones.
- Alkaline series rocks are enriched in alkalis and are commonly associated with intraplate settings.
- Peralkaline series rocks have a high alkali content relative to aluminum.
- The green squares and black circles plot mainly in the calc-alkaline field, suggesting that these granites likely formed in a tectonic setting related to subduction zones or continental arc magmatism.